A Multithreading Saga, Part 3
This is the final post of a three part series. In part one, we discussed the performance problems that we found with our activity feed and some of the changes we made to the way we use dispatch queues. Then in part two, we discussed the complexities of threading with JavaScriptCore and the rewrite of our feed item renderer.
With our new JavaScript rendering system in place, things were looking better. We weren’t done though. While reports of the app freezing seemed to have gone away, we were still experiencing some lagginess while scrolling through the activity feed. Our rewrite of the JavaScript renderer had knocked out the biggest performance issue, but there were still targeted improvements to make.
Runtime Complexity
Our updates to the app’s threading story had mitigated most of the side effects that slowdowns in the rendering process had on the rest of the app, but we still didn’t know why the rendering was taking so long. Looking back at the time profiles we had done earlier, we found a surprisingly large portion of the time was spent converting the JSON output of the script into protobuf objects, in order to match the data format of the rest of the activity data.
Protobuf uses tag numbers to reference fields, as opposed to the string names used in JSON. In order to convert a field from JSON into the corresponding protobuf field, we looped over each of the field descriptors until we found one with a matching name, then appended the data using that field’s tag number. By doing this for each field in the JSON, we had created an O(n²) algorithm to parse the JSON, where n is the number of fields in the proto.
Once we had identified the problem, we moved the field mapping logic out in front of the parsing, so we only had to loop over the fields in the proto once. This brought our algorithmic time complexity down to O(n). The number of fields on each proto is relatively small, so the time difference for parsing a single proto may not look significant, but this difference can really add up over thousands of payments.
To confirm our changes were having a positive effect on the performance, we wrote a couple of performance tests that parsed a thousand sparsely-populated protos and densely-populated protos, respectively.
| Sparse | Dense | |
|---|---|---|
| O(n²) Algorithm | 0.011 sec | 4.729 sec |
| O(n) Algorithm | 0.262 sec | 0.607 sec |
As expected, the densely-populated proto showed the largest change in performance, since the n in the complexity is large. The sparsely-populated proto, which was designed as a worst case scenario, took longer to parse after the change, since it now had to map fields that were not actually set in the JSON. Given that most of our protos are densely populated, the improvements to parsing densely-populated protos far outweighed this, and helped to cut down on how much of the rendering process was spent in the parsing phase.
Atomic Access
Another area that we found surprising in the time profile was inside our feed item provider. In order to ensure thread safety between the items read by the interface layer and the items written by the rendering layer, we had created a structure around a few key properties that ensured atomic access. This was accomplished using a concurrent dispatch queue, which allowed reads to happen in parallel, while writes could safely occur inside a barrier block.
While investigating why so much time was spent in this mechanism, we came across a series of performance tests that compared different methods of ensuring atomic access. These tests showed that dispatch queues were one of the more expensive mechanisms available.
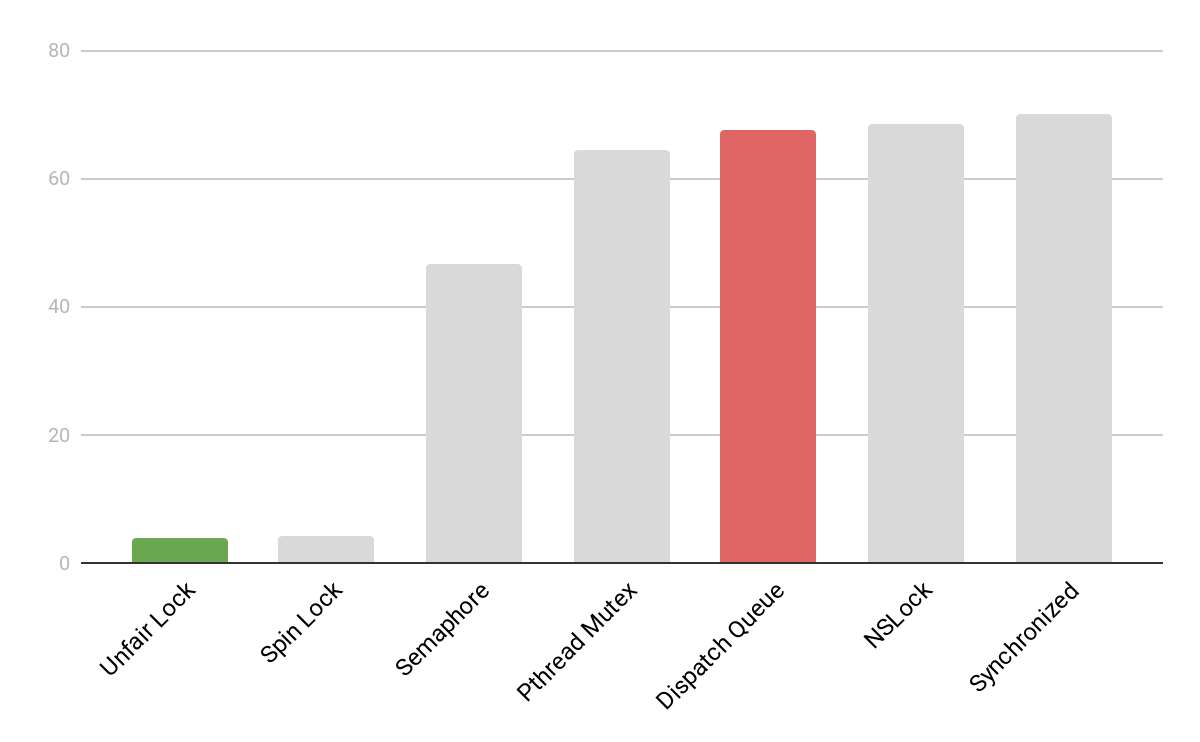 A chart showing the speed of various atomic access mechanisms, measured as the time in seconds taken to complete 100,000 iterations. Lower is better. The red and green highlighted bars represent the old and new methods we use for ensuring atomicity.
Following the conclusions from these tests, we changed our atomic access structure to use os_unfair_lock instead of dispatch queues. Another round of time profiling indicated that atomic access was now a negligible contributor to the time taken in rendering a feed item.
These targeted performance optimizations might seem like small improvements, but as the amount of data scales, even small improvements can make a big difference.
Measuring and Monitoring
One of the keys to successfully maintaining an app comes after the app has been released: monitoring performance. By watching metrics, we can verify that the changes we made are doing what we expect, as well as ensure that we don’t accidentally regress these improvements in the future.
We mainly use third-party crash reporting tools to monitor our crash rates. This gives us great insight into many of our crashes by including symbolicated crash logs and attaching certain metadata to crashes that helps us determine their root cause. Unfortunately, third-party tools have limitations when it comes to resource-related issues such as watchdog and out-of-memory crashes.
Fortunately, Apple’s first-party crash reporting tool does include these types of crashes. While it does not give a breakdown of what caused the crashes, we were able to compare the number of crashes reported by Apple’s tooling to the number reported by our third-party tooling, and found that the majority of crashes were missing from our third-party crash metrics. We were able to use metrics from Apple to verify that we had resolved these resource-related crashes. Following our changes to JavaScript rendering, the total crash rate as reported by Apple dropped by almost 70%.
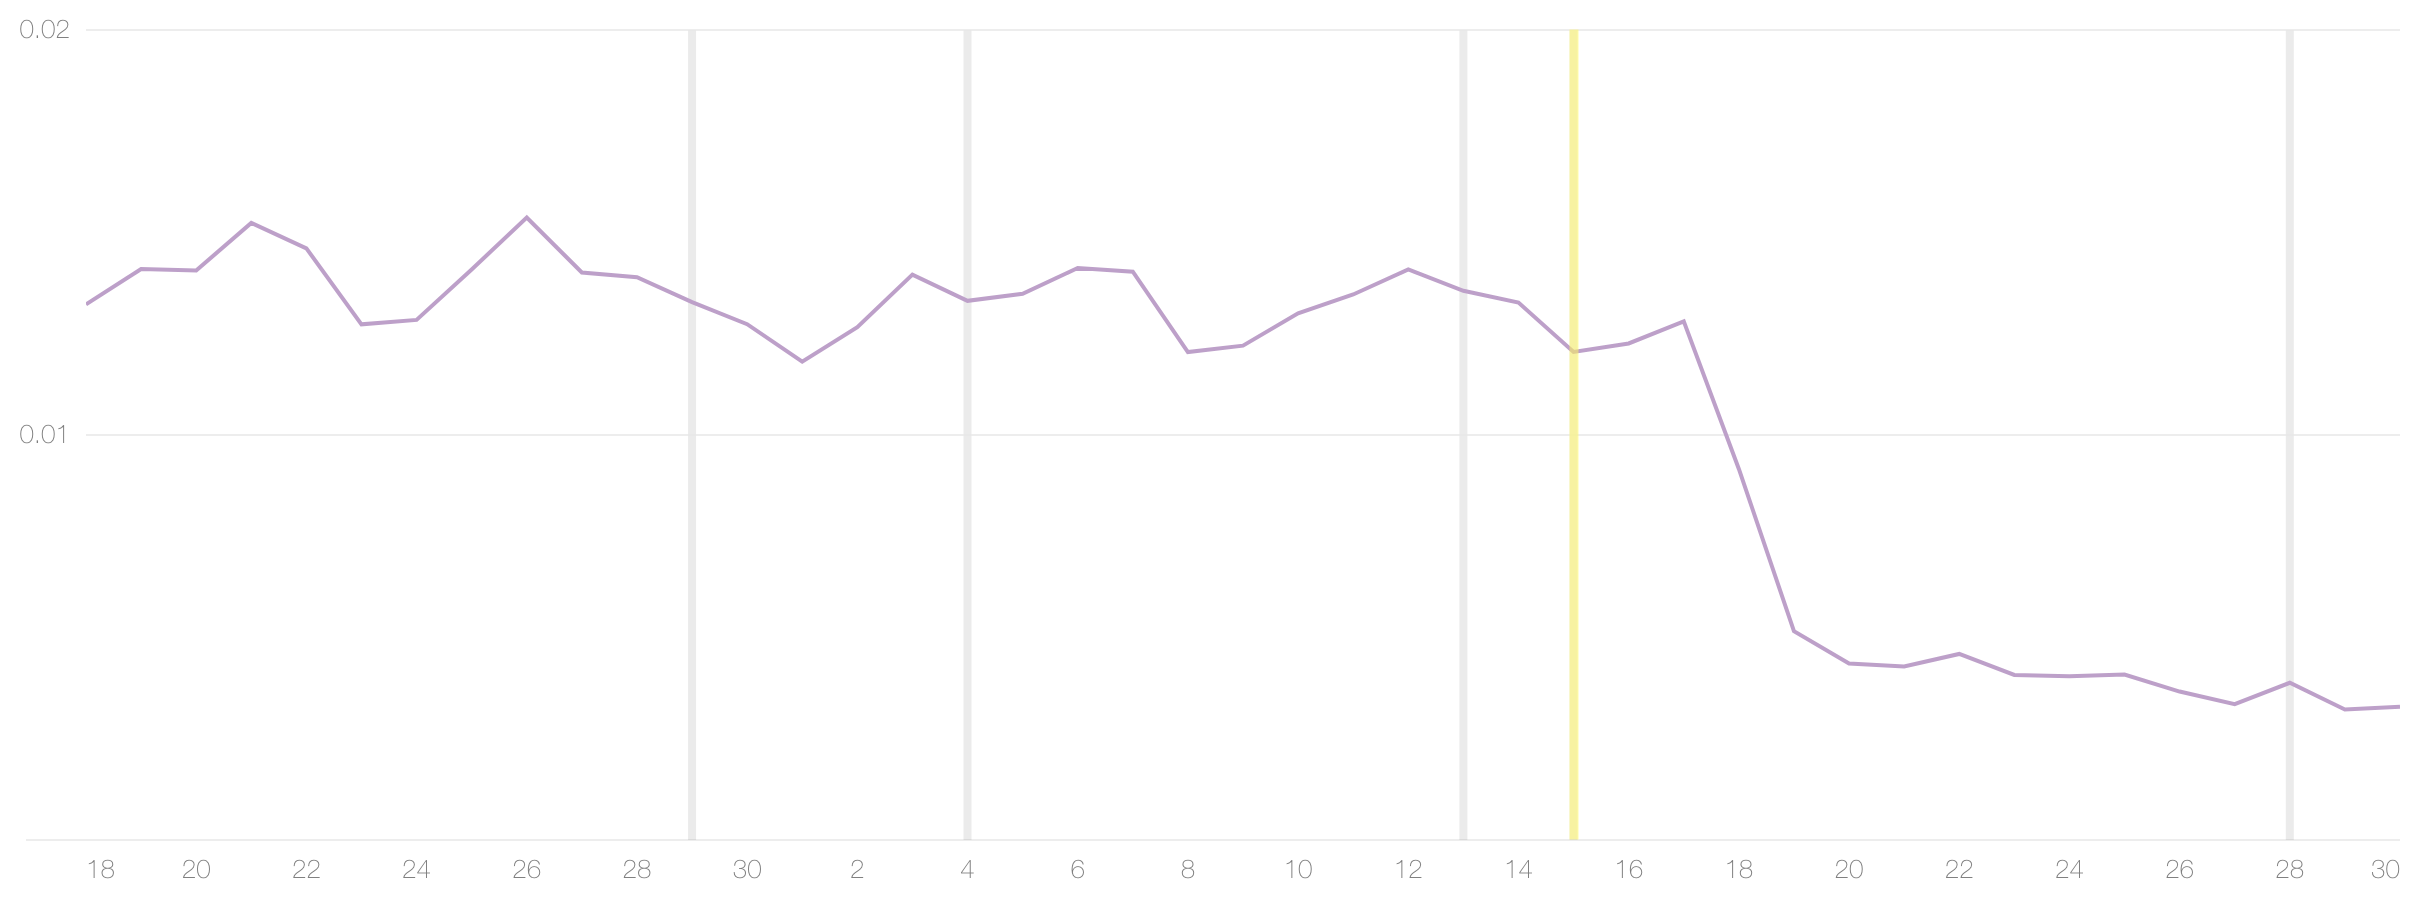 A graph of the crash rate, as reported by Apple. The vertical bars represent releases of new app versions, with the release that included the new JavaScript renderer highlighted in yellow. The effects of the release on the crash rate are delayed by a few days due to the phased rollout.
Apple also provides certain app metrics through Xcode. One of these metrics is the Hang Rate, which measures the responsiveness of the app by calculating the duration over which the app did not respond to user input. With the release of 3.14, the app version including our changes to the JavaScript rendering, the top hang rate (essentially the extreme cases) is down significantly and the typical hang rate (what most customers see) is down to zero.
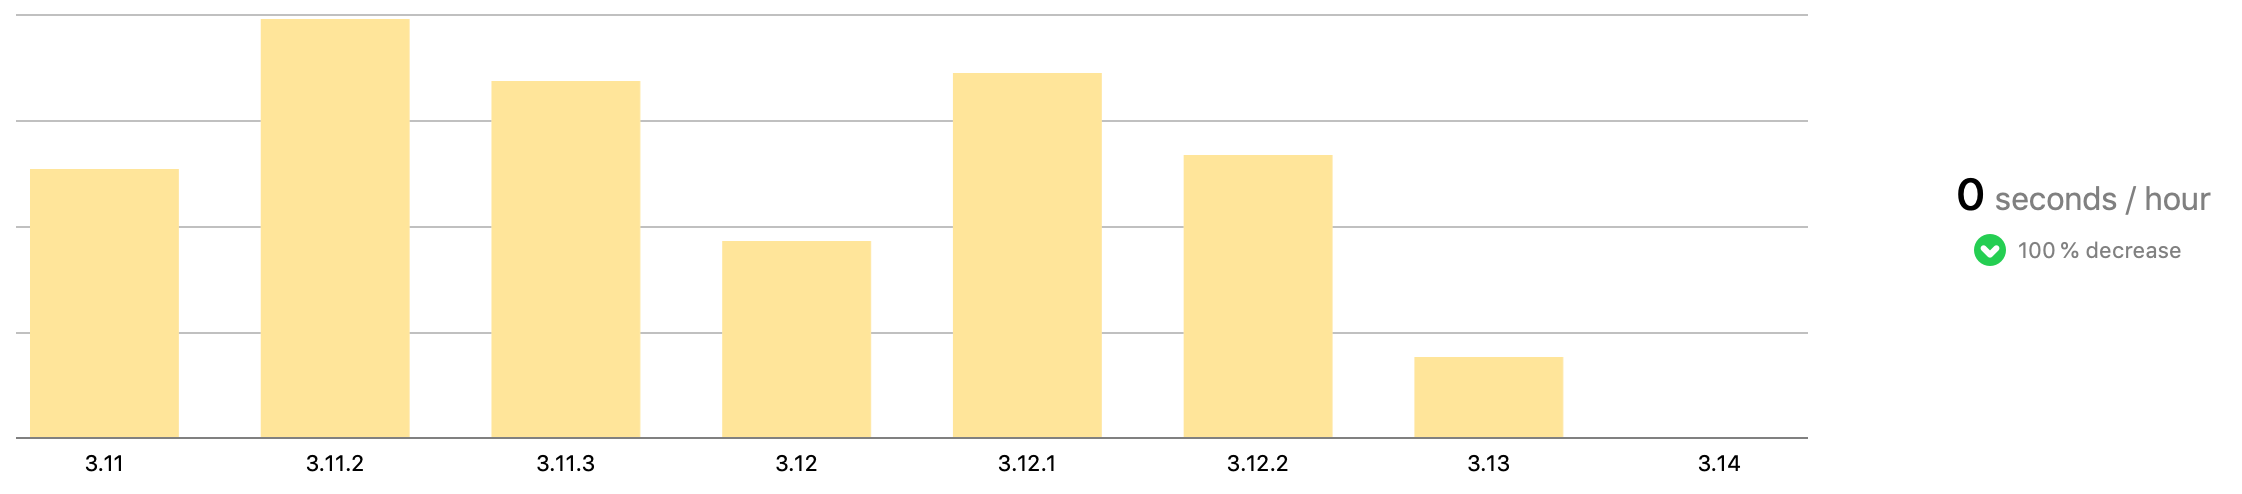 A graph of the typical hang rate, as reported by Apple. The vertical bars represent the hang rate, measured in seconds per hour of screen time, for various app versions.
The app should now run buttery smooth, but it’s possible that items in the activity feed will show a loading state if you scroll too quickly, since the items may not render fast enough. In total, it took 12 days from the virtual alarm bells going off to all of our performance improvements being made available to all customers, with some changes going out in as little as 7 days.
We’re proud of the changes we’ve made so far, but when it comes to the customer experience, we’re not happy settling for good enough. Our recent efforts have brought the app back to a stable state. Now our job is to continue making the performance even better, and ensure that future work we do does not bring along new performance issues.
What We Learned
Small improvements in common code can make big differences. Even tiny performance improvements to code run thousands of times can add up to a big time difference.
Don’t make assumptions about performance. Sometimes the slowdowns you see aren’t coming from the place you expected them to. Profile your app using Instruments to see what’s actually happening.
Look at Apple’s crash reports. Your third-party crash reporting tools may not be showing you the full picture. Make sure to periodically look at Apple’s crash reports as well to ensure that you aren’t missing anything.
Debugging performance problems can be a daunting task, especially when dealing with multi-threaded code, but the benefits of doing so can be huge.