A Multithreading Saga, Part 1
This is the first post of a three part series discussing recent performance improvements we made in our iOS app.
As a product scales, new problems become evident. Some of these problems can be addressed early on, but it’s often necessary to make trade-offs between avoiding future problems and moving quickly to develop new features. For us, improving the performance of our threading code was something in the back of our minds, but not an immediate priority.
The app syncs all of your activity (payments, card transactions, stock purchases, etc.) so you can view and search through your account history quickly, even when you don’t have an Internet connection. For most customers this process is seamless. For some of our long-time customers that use the app daily though, this can mean thousands of items are synced to the device, which can result in performance issues. A few of our longest-tenured employees have exceptionally large activity feeds, so we use them as canaries. When these employees started reporting performance issues, we knew problems were on the horizon. But we thought we had plenty of time to solve them.
It was a quiet Tuesday afternoon when the virtual alarm bells started ringing. The day before we had started rolling out a dot release of our iOS app to address some small bugs, but the problems hadn’t gone away. In fact, the release actually made the performance worse and we were getting reports of the app freezing. An issue that had been out on the horizon had suddenly turned into an immediate top priority for the team.
Investigating the Problem
While many people were seeing a varying degree of slowdown on their accounts, the large accounts saw it the worst. We received a few reports of what appeared to be watchdog crashes, where Apple terminates the app after it takes too long to respond. These crashes weren’t showing up in our crash reporting tool, but that’s somewhat expected since the bug introduced caused the app to become unresponsive and fail to handle the crash report. Without clear indicators of where the problem was originating, we knew we needed to find a way to consistently reproduce it locally.
One of our server engineers set up a staging account with thousands of fake card transactions, so we could simulate a very large activity feed. This account immediately reproduced the reports we were hearing of the app locking up and crashing.
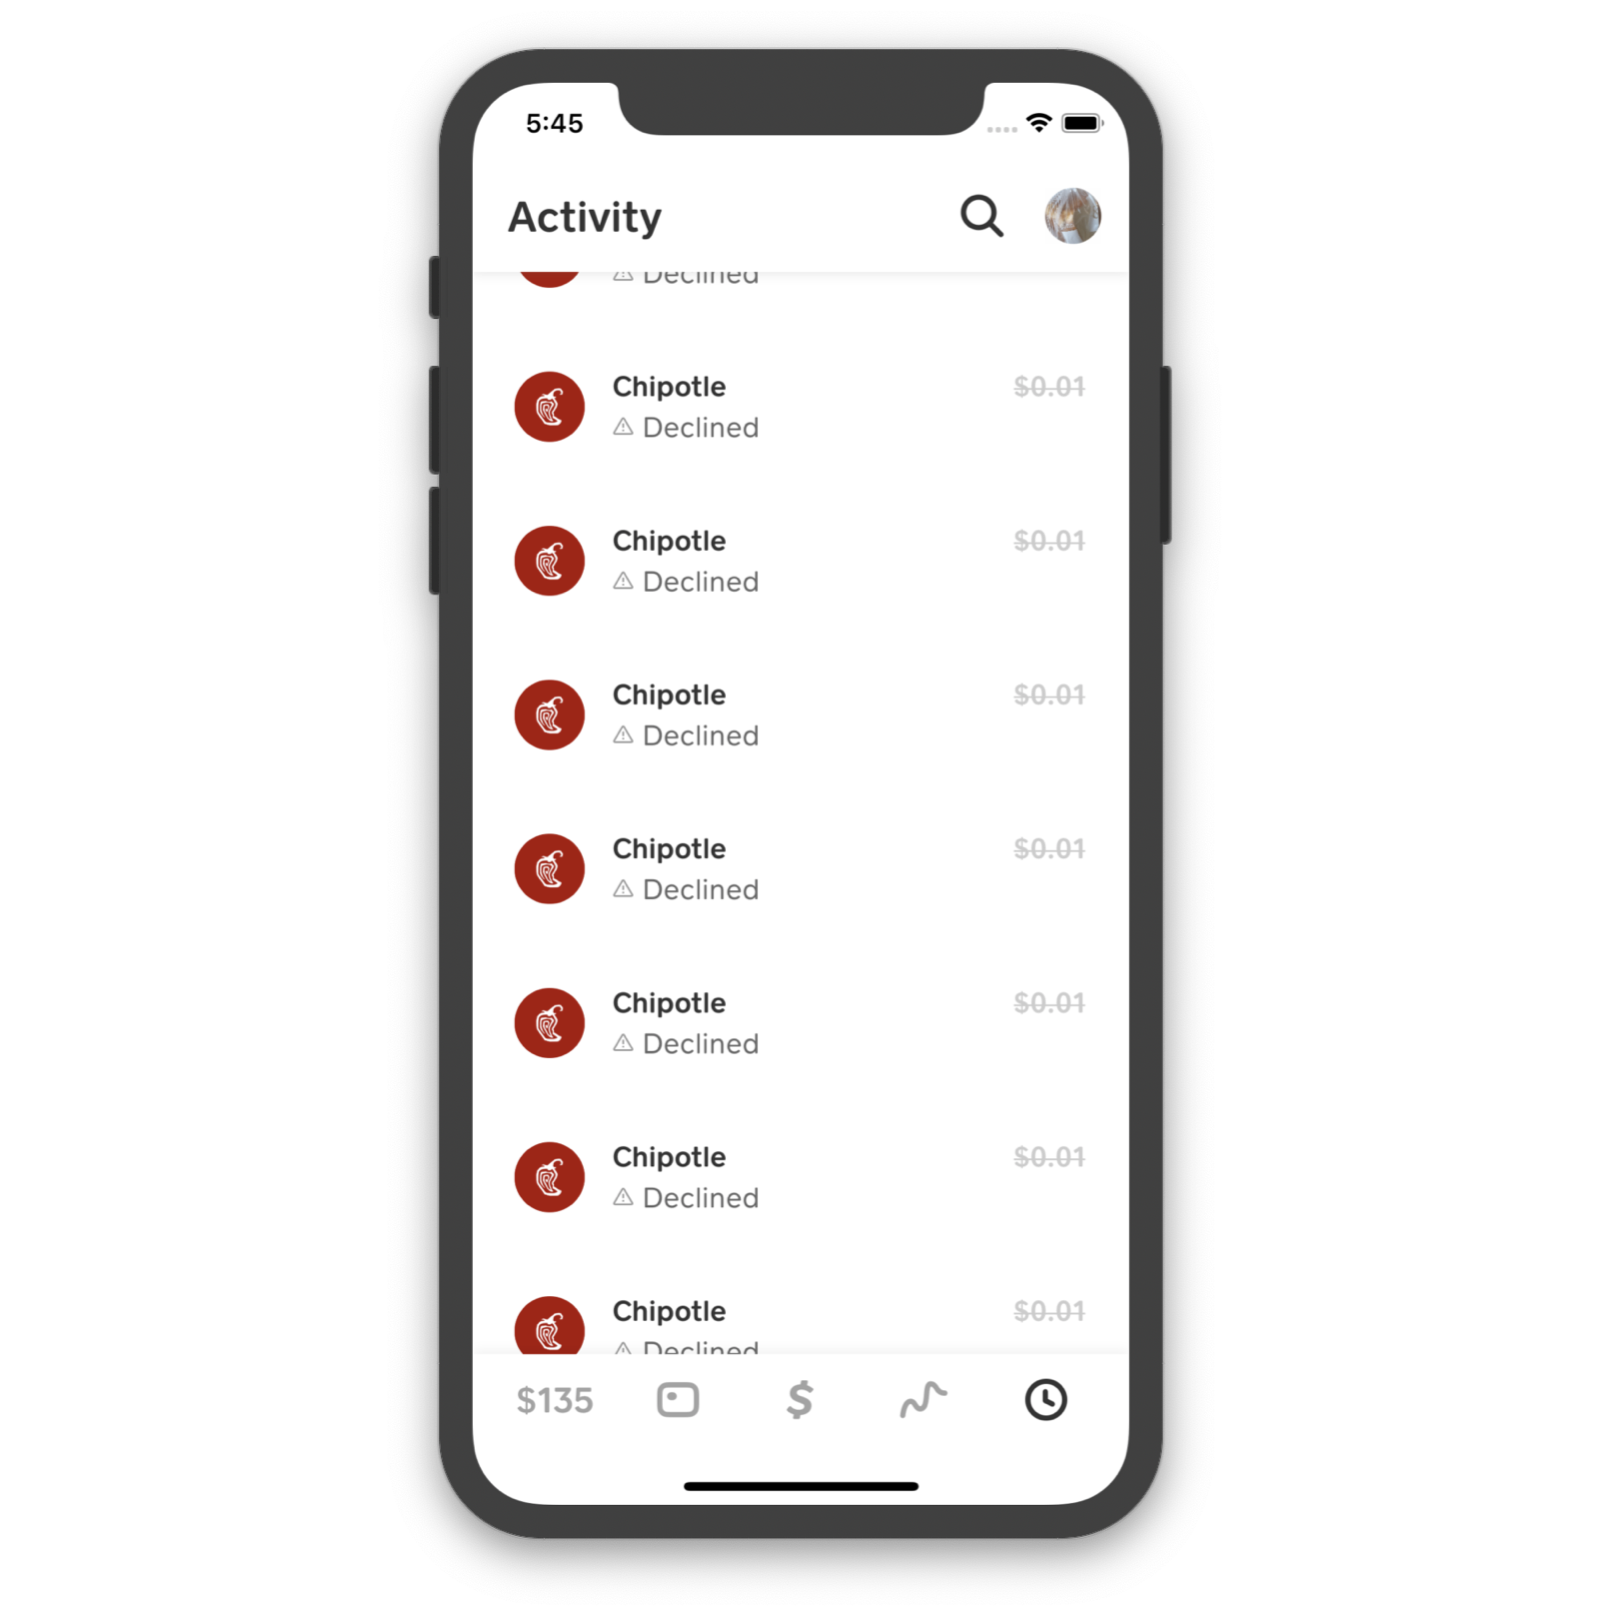 A screenshot of the activity feed from a staging account with thousands of simulated card transactions, which we used to test how the app handles large amounts of data.
We profiled the app using the time profiler in Instruments and took note of what methods were taking the most time. A few methods stood out as taking longer than expected, but the biggest surprise was the number of threads that showed up.
Too Many Queues
It became obvious fairly quickly that we were dealing with a bad case of thread proliferation. Pausing execution to inspect the app after it froze, we found that there were close to 1400 threads, way more than the magical computers in our pockets could handle.
 A screenshot of Xcode’s CPU report detailing the current threads spun up by the app.
Each of these threads was executing the rendering code for a single item in the activity feed. Instead of creating a pool of threads and rotating through them to process items, the system was creating a new thread for each item. Upon investigation, we found that each item was being assigned a new dispatch queue, rather than using a single shared queue. Since the items were each on their own queue, they weren’t sharing resources, leading to the thread proliferation that we observed. We wanted to verify that this was the problem, and found our confirmation in Apple’s documentation for DispatchQueue:
Another way that apps consume too many threads is by creating too many private concurrent dispatch queues. Because each dispatch queue consumes thread resources, creating additional concurrent dispatch queues exacerbates the thread consumption problem.
As we looked through where each thread was paused, we found that a surprising number were stuck in the same spot. Reducing the number of queues wasn’t enough; we also needed to ensure we were using the right queue at any given time.
Too Many Jumps
We started looking into the code that was being run on these queues and discovered a handful of unnecessary jumps between queues. We ran code on a background queue, which kicked off work on another background queue, and so on.
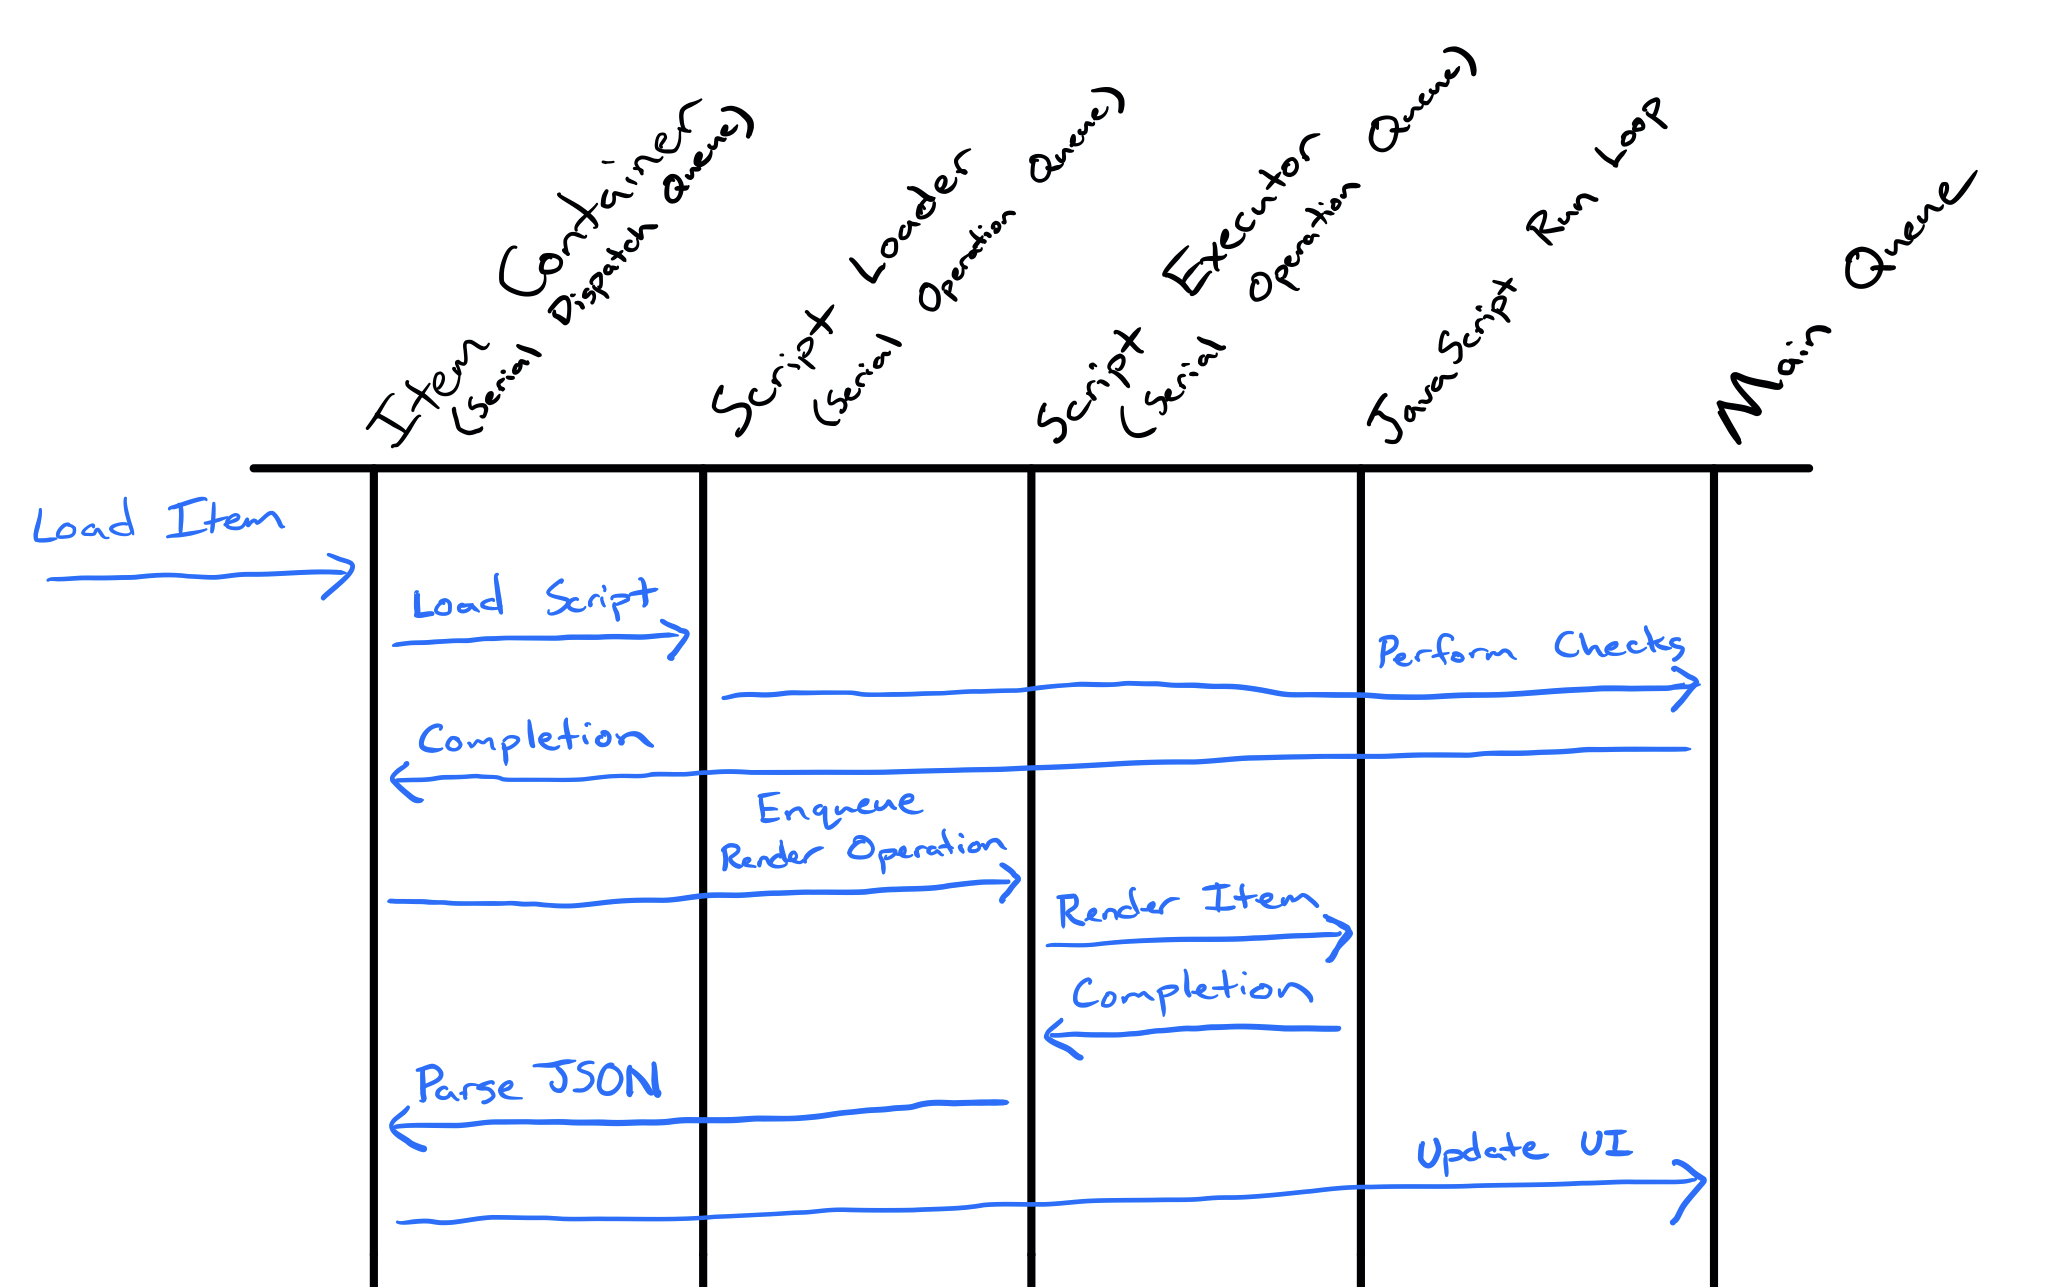 A diagram showing one of the code paths that rendering an item can follow. Each of the blue arrows shows a jump between two queues.
Much of this wasn’t needed, since it left many background threads sitting idle. We were able to consolidate some of these tasks, reducing the number of times the app jumped between queues for each item.
At certain places, we needed to deal with UI, so we had added async dispatches to the main queue to ensure that we weren’t accessing any of our views from a background thread. Through investigation, it turned out that those methods were always being called on the main queue already, so the thread jumps were completely unnecessary.
Removing the extra thread jumps was straightforward, but we wanted to know why they had gotten that way in the first place.
Confusion through Abstractions
The activity feed is architected using a series of abstraction layers. The interface layer talks to a feed item provider. The feed item provider talks to a generic item transformer. The generic item transformer talks to an item loader and an item renderer.
Having these layers of abstraction makes it easier to reason about individual pieces of logic and make improvements to them independently. Unfortunately, multiple layers tried to solve the threading problem, and their solutions ended up conflicting with each other.
Beyond solving the problem we were seeing, we wanted to make sure that our threading wouldn’t regress in the future. One way we did this is by exposing threading details in the API surface of each layer. For example, one method always calls its completion handler after async dispatching to another queue. To make it clear this was happening, we made the completion queue be a required parameter to the method. Now it would be more clear when we were unnecessarily jumping threads:
object.doSomethingAsync(completionQueue: .main) {
    DispatchQueue.main.async {
        // ...
    }
}
By Friday, we felt confident that our improvements had reduced the number of threads by enough to keep the app from locking up for most people and that our API made it less likely for our changes to regress. We had bought ourselves enough headroom to unblock the current release, but we still hadn’t gotten to the root of our problems.
What We Learned
Through dealing with this case of thread proliferation, we learned some important lessons that can be applied to many situations that involve writing multithreaded code.
Avoid creating too many dispatch queues. Share dispatch queues between objects where appropriate. Creating too many queues can overwhelm the system, eating up valuable resources and causing performance issues for your users.
Avoid jumping between threads unnecessarily. The ability to run code asynchronously on a background thread is an incredibly powerful tool. But there’s also a cost associated with switching threads, so be careful not to dispatch code to a queue unless it’s necessary.
Make threading obvious. Building abstractions is important, but hiding details about threading can lead to problems. Make it obvious when your code has specific behavior around threading.
In part two, we’ll discuss our explorations of threading with JavaScriptCore.