A Multithreading Saga, Part 2
This is the second post of a three part series. In part one, we discussed the performance problems that we found with our activity feed and some of the changes we made to the way we use dispatch queues.
Solving our problems with thread proliferation bought us some headroom to unblock the current release, so things began to return to normal. We hadn’t gotten to the root of our problems, though; most people were seeing a fairly smooth experience, but the app was still freezing up for a few of our massive canary accounts. We profiled the app again and found that there were still more threads than seemed necessary, and many of those threads were getting stuck.
Threading and JavaScript
The app uses JavaScript to render each payment, much of which we do in parallel by calling the render script from multiple background threads. While pausing app execution to inspect the state of each thread, we found threads were often getting stuck inside our JavaScript renderer.
We searched for similar issues others had seen and found reports of a crash caused by the JSContext not getting released properly. Using the memory debugger in Xcode, we looked at all of the objects in JavaScriptCore that had been retained. We only found two JSContext instances, but found a ton of JSValue instances.
JavaScriptCore has very strict guidelines around thread safety, and similar to CoreData, certain JavaScript resources are constrained to a single thread. On the completion of our rendering script, we have a JSValue instance that contains a JSON string. We pass this JSValue over to a JSON parser, which pulls out the string and parses the JSON into a structured object. Despite the name, these JSValues are not simple value objects, but rather are backed by just-in-time code that calls back into the virtual machine. The problem was that the parser was on a different background thread, which, by having a reference to the JSValue, was indirectly accessing the JSVirtualMachine across multiple threads.
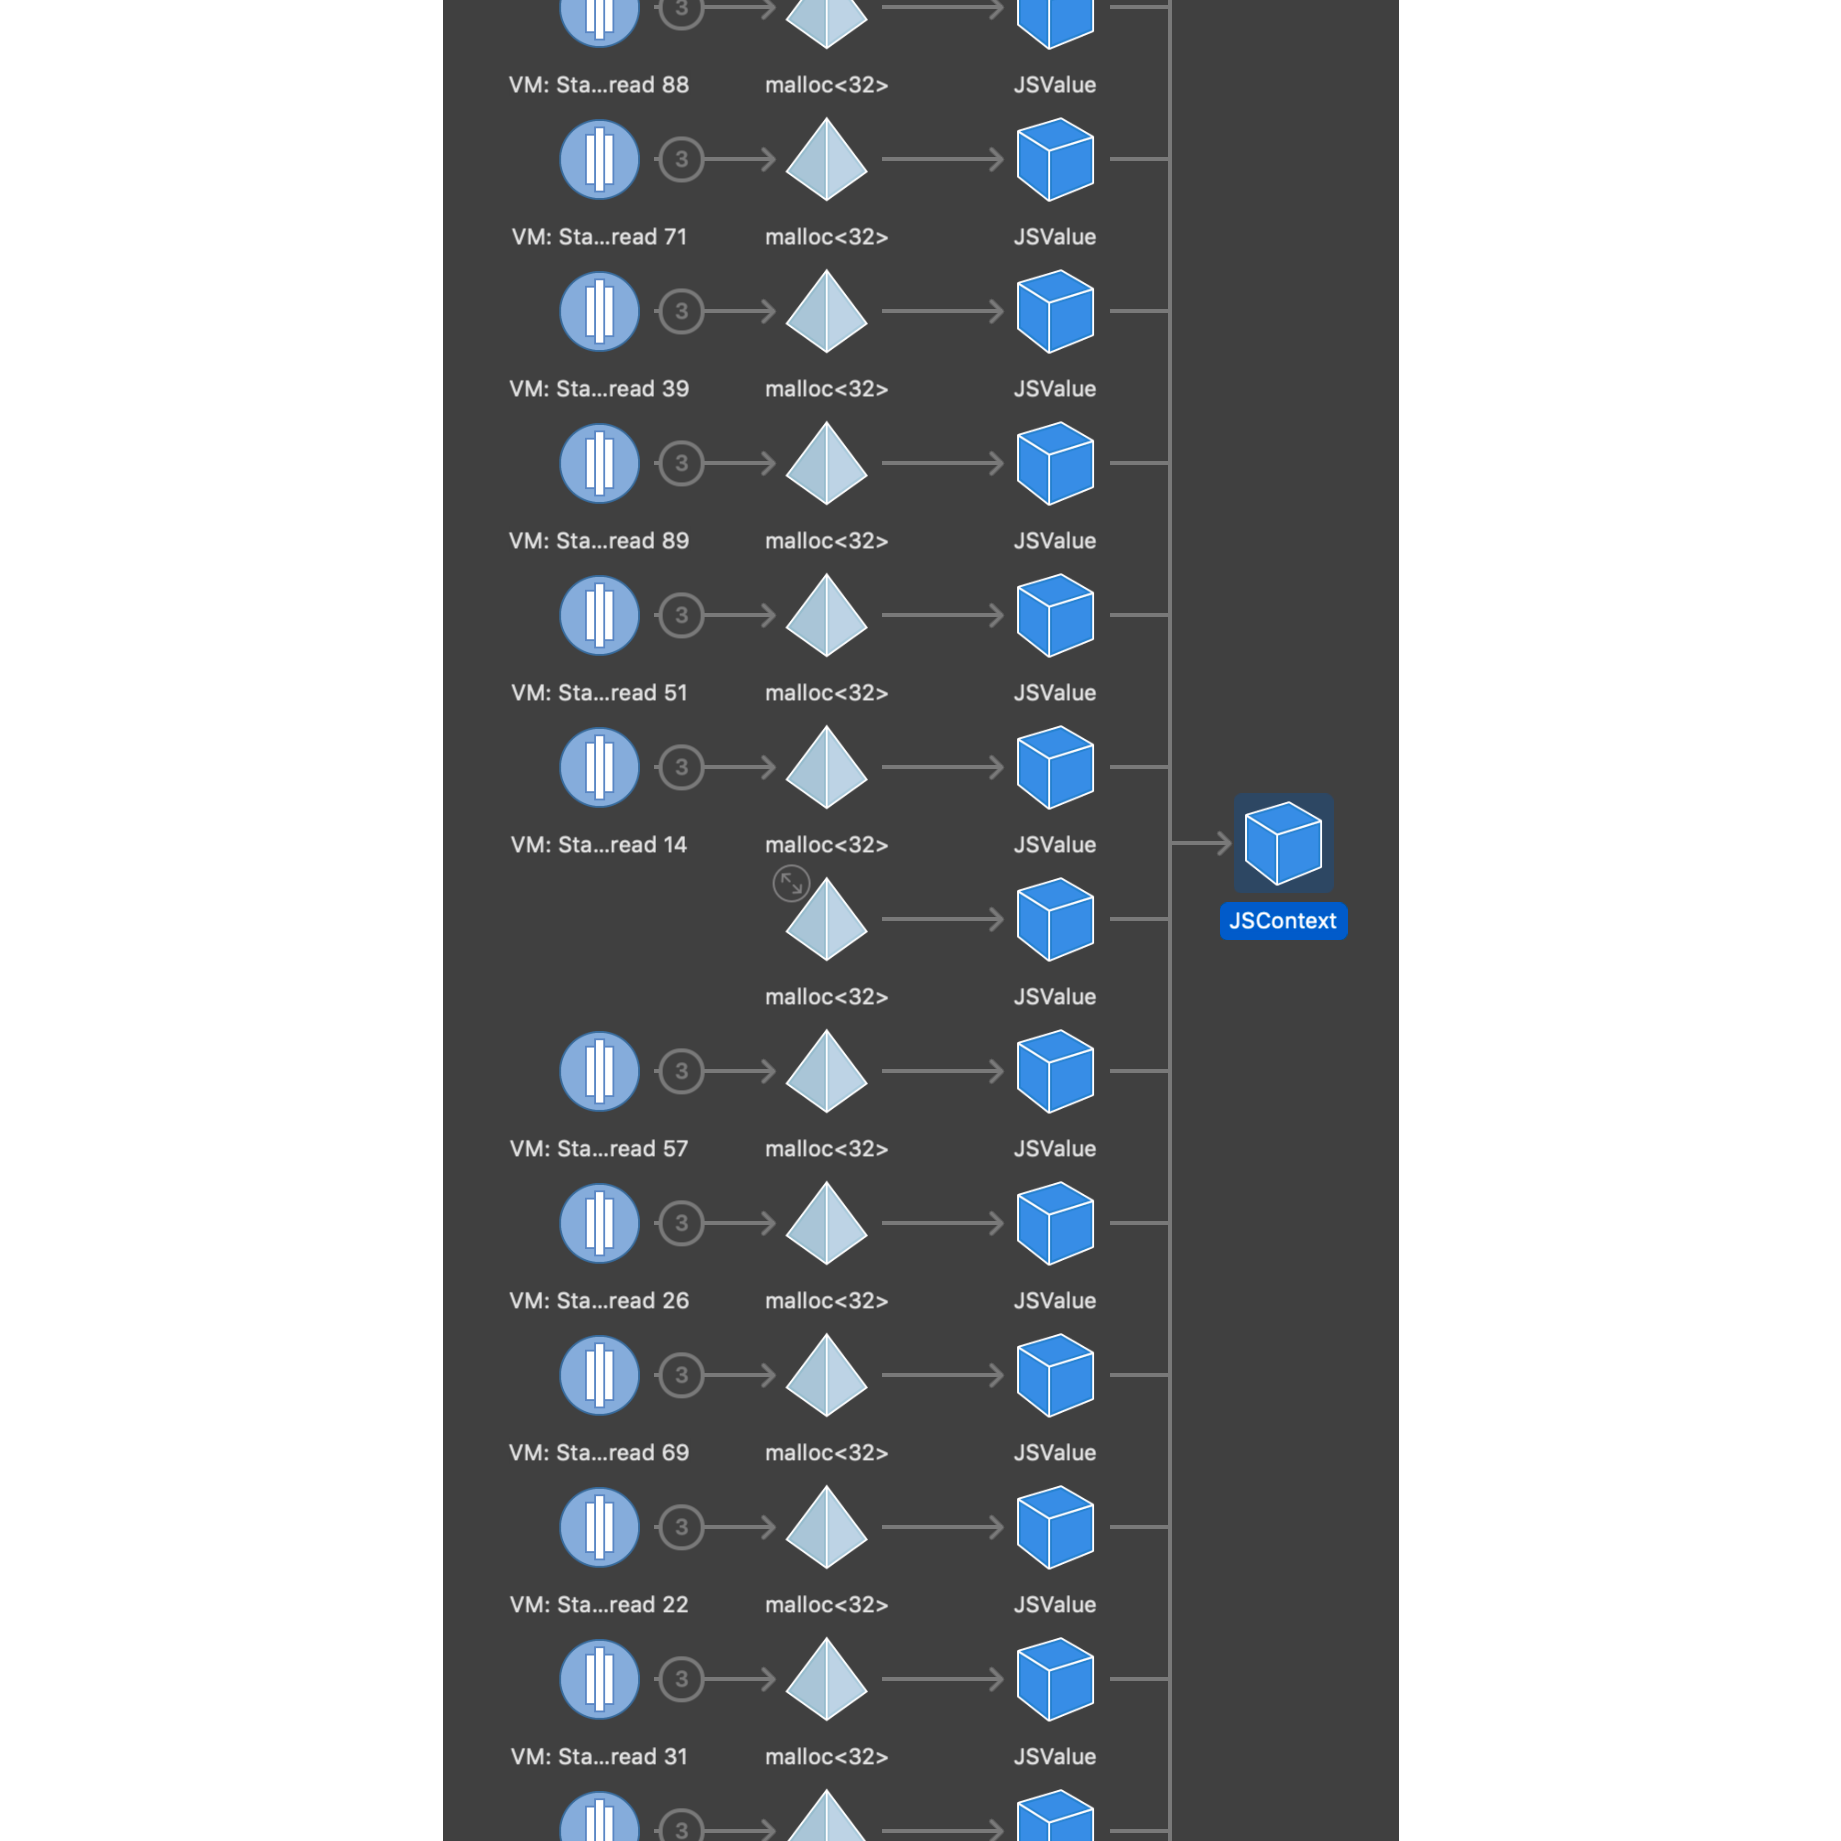 A screenshot from the Xcode memory graph showing a series of JSValue instances holding references to a single JSContext, which holds onto the JSVirtualMachine.
Unfortunately, there wasn’t a simple, targeted fix for this problem. We ended up having to rewrite a significant portion of our JavaScript renderer in order to change the threading story. On the upside, rewriting a system is a great opportunity to take learnings from the past and make leaps forward in improving the API. Our new JavaScript renderer has far improved threading support, with a garbage-collected pool of reusable JavaScript virtual machines, and has now been fully Swift-ified.
With any big change, however, comes some amount of risk; and since our efforts were meant to bring stability back to the releases, increasing risk was the last thing we wanted to do. We took a few steps to increase our confidence in the changes. First, almost all of the new functionality was written during pairing sessions, which meant that there had already been two pairs of eyes on the code before we opened a PR, at which point we required two additional reviews. Second, we scoped the change down to only one of the usages of the JavaScript rendering. We picked the main usage, so there was still risk here, but it reduced the area of the app that we needed to test to confirm the change. Finally, we utilized a feature flag to control which version of the renderer was used, giving ourselves the option to roll back to the older version if new problems arose.
We finished our rewrite the Tuesday following the virtual alarm bells going off, one week from when we had begun the sprint to restabilize the app. The changes were rolled out to our internal build for thorough testing and we got feedback that scrolling through the activity feed was feeling much smoother. We knew we still had work to do though.
Speeding Up JavaScript
The longest task in rendering a payment is running the JavaScript. This is not surprising, since this task contains the majority of the work. Unfortunately, most of this happens inside JavaScriptCore (JSC), making it difficult to profile what inside the JavaScript takes the most time. Still, we are able to see which system methods JSC calls out to, giving us some insight into what parts of the script are expensive to run.
One common call we found out of JSC was to check the current time zone. The rendering logic deals with dates in multiple places, mainly in order to format the display versions of the dates properly based on how far in the future/past they are. We searched for time zone problems related to threading and found that the DarwinNotify mechanism used for caching the time zone in memory did not work as expected after forking. This meant that JSC had to read the time zone from disk far more often than it should.
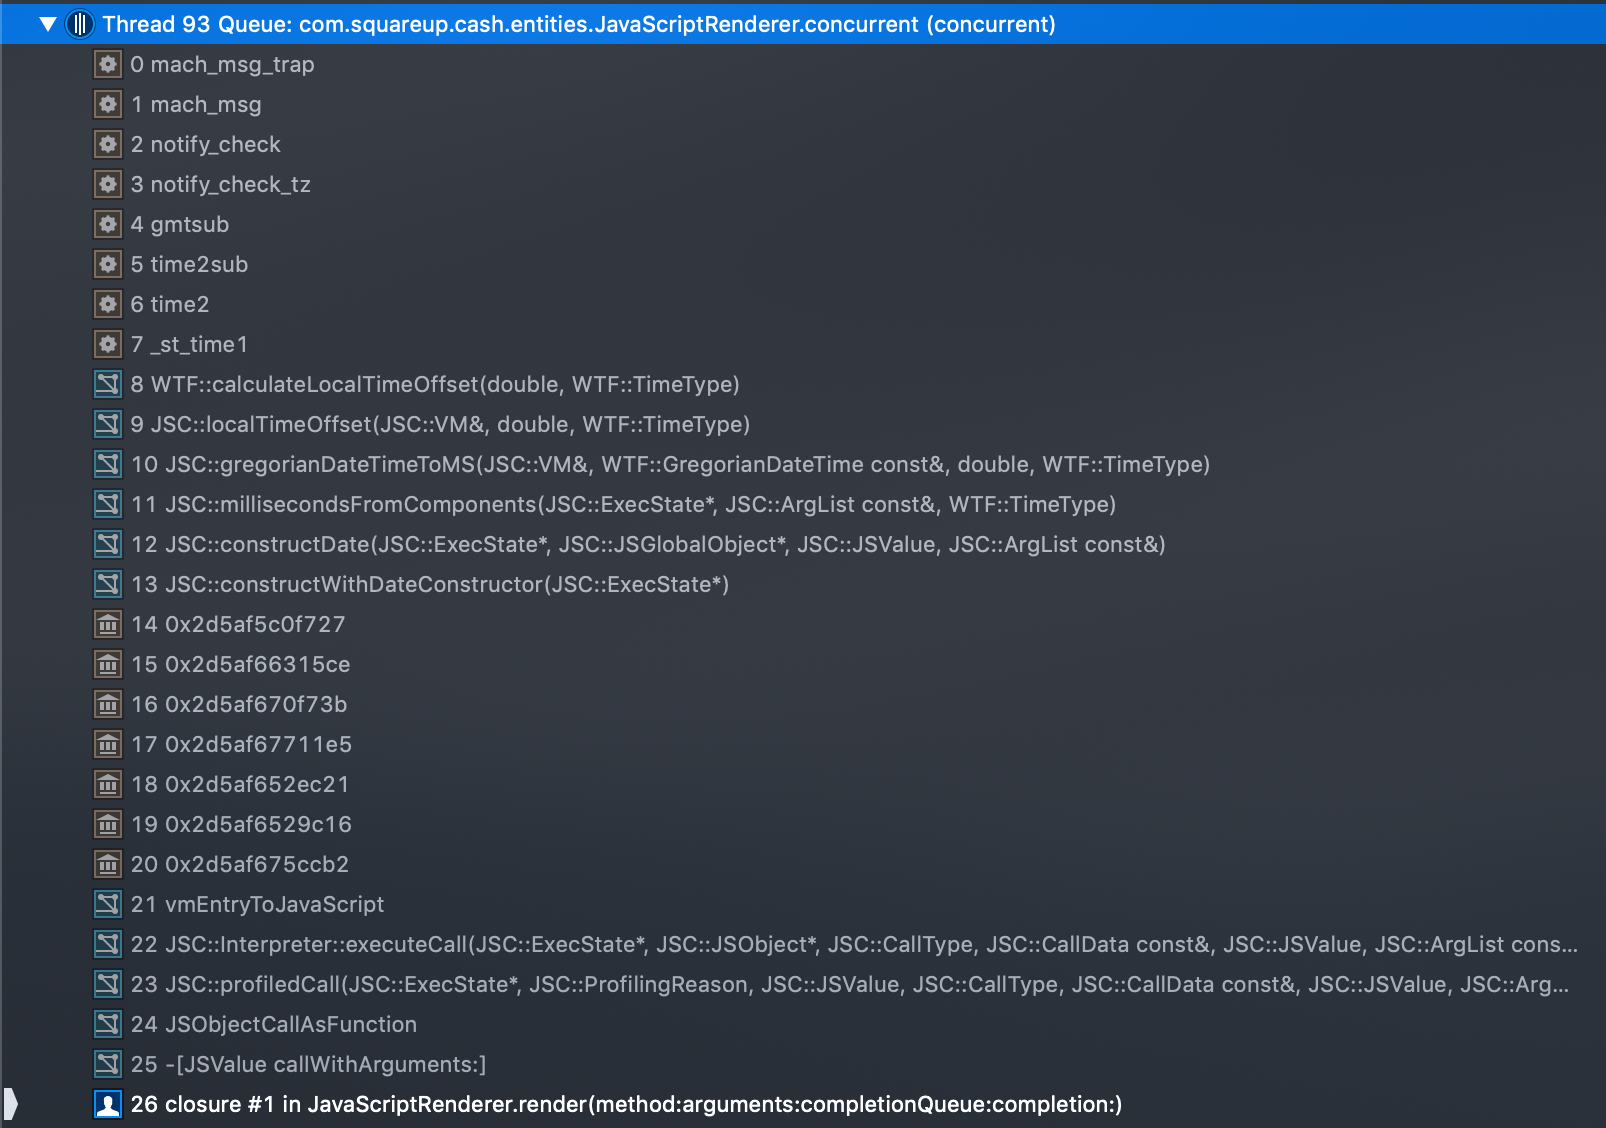 A stack trace showing JavaScriptCore calling through to the DarwinNotify API to check if the time zone has changed.
Since we don’t have control over JSC, we’re required to work around the problem by decreasing the number of date reads in the logic. Much of this work around improving the rendering script is still in progress.
What We Learned
JavaScriptCore is a powerful framework, but it’s easy to get into trouble when trying to run it across multiple threads. Learning the threading characteristics of a framework is an important step in ensuring it works as intended in your app.
Avoid passing any JavaScriptCore objects across threads. When using JavaScriptCore, be mindful of what threads you’re calling certain objects from (including JSValue). When in doubt, confine JSC objects to a specific thread.
Mitigate the risk of large changes. Any big change comes with a certain amount of risk; but using techniques like pair programming, strategic scoping, and feature flags can raise confidence in the change and increase the likelihood of a successful release.
Not all JavaScript functionality runs the same. There may be some surprising performance characteristics in innocuous looking code. While the tooling for debugging performance in JSC is limited, it can be worthwhile to spend some time optimizing your scripts.
In the conclusion to our multithreading saga, we’ll talk about some of the final targeted improvements we made, as well as take a look at the resulting metrics.